The Looming Market Correction: Preparing for a Downturn

The S&P 500 reached a new high last week, but technical indicators suggest a correction may be imminent. The 14-day RSI has remained above 70 for three weeks, indicating overbought conditions, and a negative divergence is forming, where prices peaked while the RSI made a lower high. Currently, the VIX is in the mid-teens, a level often seen before significant market declines, which reflects a sense of complacency despite deteriorating market breadth and technical signals. Sentiment is also pressured by budget-friendly Chinese AI products and ongoing geopolitical tensions, alongside rising energy costs that could tighten credit and slow consumer spending. The SPY ETF, which tracks the S&P 500, is experiencing the highest correction risk since early 2022, especially as we approach the November elections. Traders should keep an eye on inflationary pressures from tariffs, as this could hinder potential Fed rate cuts and lead to a more substantial pullback in the market. ...

July 19, 2026 · ActiveTradingClub

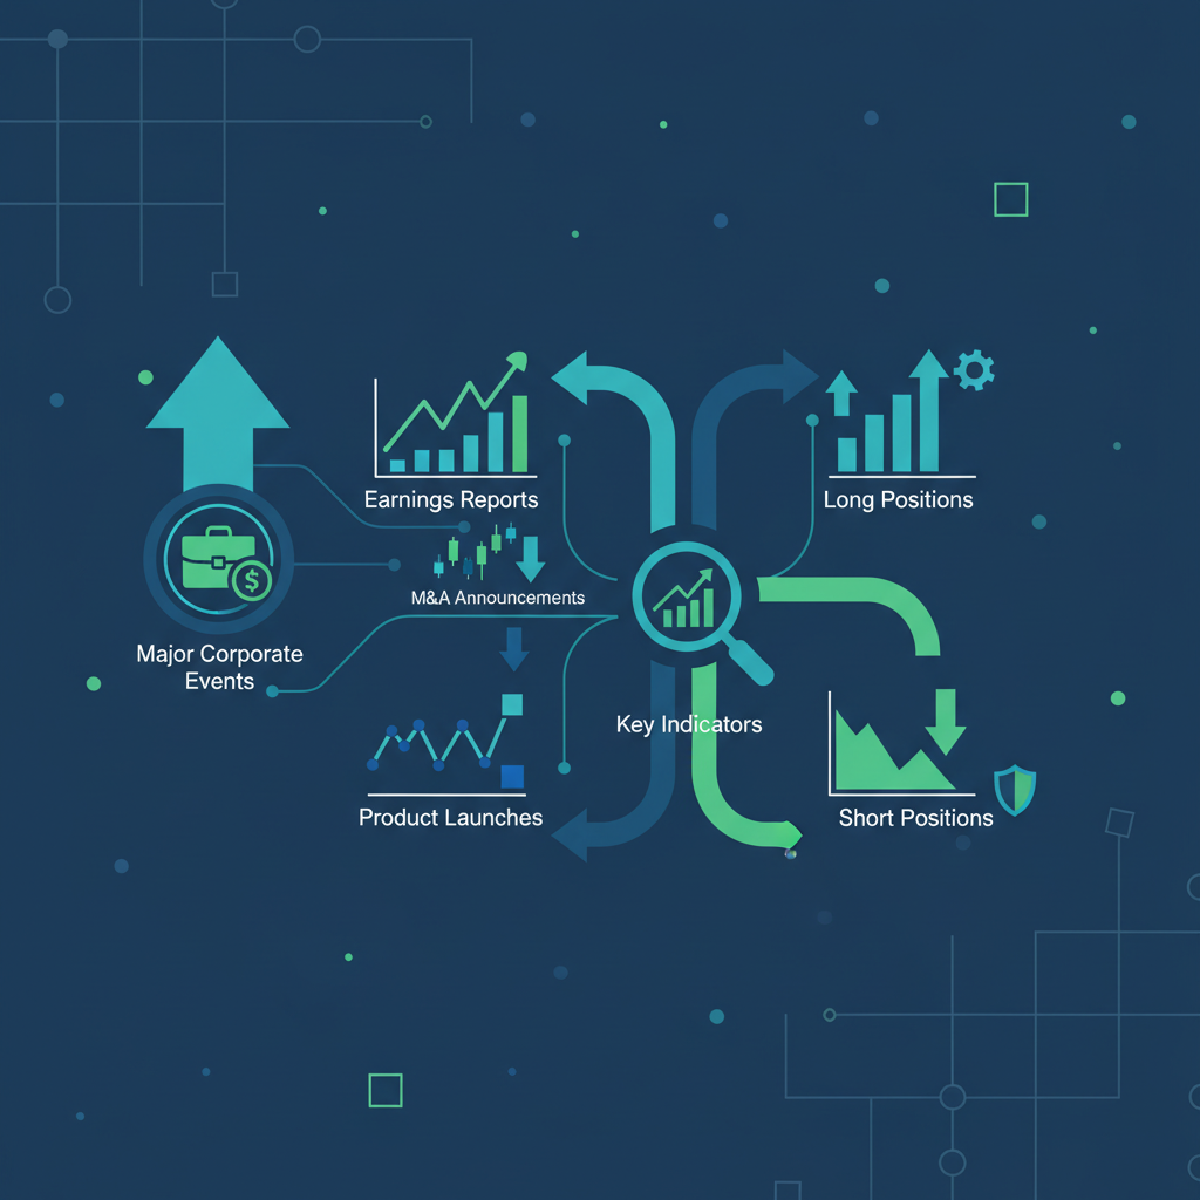
Key Indicators: How to Trade Around Major Corporate Events

Key Indicators: How to Trade Around Major Corporate Events Major corporate events can significantly influence stock prices, as seen in instances like Apple’s earnings report on July 31, 2022, which resulted in a 10% drop. These events present both opportunities and risks for traders. It’s essential not just to predict the outcomes but to understand the indicators that matter beforehand, how prices respond afterward, and how to manage risks when volatility increases. ...

June 17, 2026 · ActiveTrading.club Team
Privacy settings