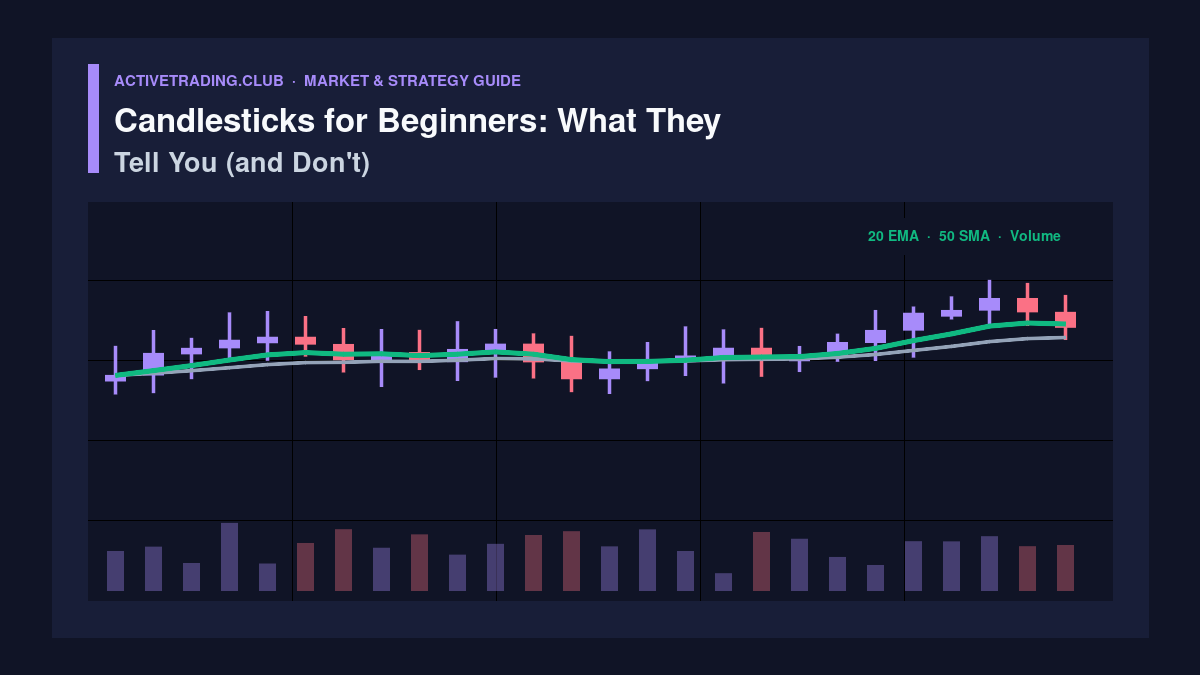
Candlesticks for Beginners: What They Tell Us, What They Don’t (And How to Trade Them Right)
If you’re new to trading, candlesticks are your first and most powerful tool for reading the market. They don’t just show price—they reveal psychology, momentum, and reversal signals. But here’s the critical truth most beginners miss: candlesticks don’t guarantee the future. They tell you what has happened and what might happen, but only when combined with context, volume, and confirmation. This guide will break down exactly what candlesticks tell you, what they don’t, and how to trade them with real examples.
What Is a Candlestick? The 4 Essential Components
Before diving into patterns, you need to understand what a single candlestick represents. Every candle is built from four price points for a specific time period (e.g., 1 day, 1 hour, 1 week)[7]:
| Component | What It Means |
|---|---|
| Open | Price at the start of the period |
| High | Highest price reached during the period |
| Low | Lowest price reached during the period |
| Close | Price at the end of the period |
These four points create three visual parts:
- Real Body: The thick colored rectangle between open and close.
- Green/White = Close > Open (bullish)
- Red/Black = Close < Open (bearish)
- Upper Shadow (Wick): Line from the top of the body to the high.
- Lower Shadow (Wick): Line from the bottom of the body to the low.
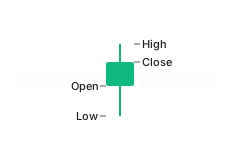
Example: If a stock opens at $50, rises to $55, drops to $48, and closes at $52, the candle has:
- Green body ($50 → $52)
- Upper shadow ($52 → $55)
- Lower shadow ($50 → $48)
This visual structure lets you instantly see who won the battle—buyers or sellers—and how aggressive the move was.
What Candlesticks Tell You: 5 Key Insights

Candlesticks are far more than price charts. They reveal market sentiment and trader behavior. Here’s what they actually communicate:
1. Bullish vs. Bearish Momentum
- A long green body with small wicks = strong buying pressure.
- A long red body with small wicks = strong selling pressure.
- Growing candle size in a trend = momentum increasing.
- Shrinking candle size = momentum fading.
Real Example: In a downtrend, if red candles get shorter and shorter, it signals sellers are losing control. This often precedes a reversal.
2. Reversal Signals at Key Levels
Single-candle patterns like the Hammer (after a decline) or Shooting Star (after a rise) often mark reversals only if they appear at resistance/support.
Example: A Hammer appears after a 10% drop in a stock, right at a 50-day moving average. This is a high-probability bullish reversal signal.
3. Indecision and Confusion
- Doji (open = close) = market indecision.
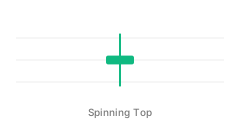
- Spinning Top (small body, long wicks on both sides) = confusion between buyers and sellers.
- A Doji after a long uptrend is more significant than mid-trend.
Real Example: After a 20% rally, a Doji forms at a major resistance level. This suggests buyers are exhausted, and a pullback may follow.
4. Strength of Continuation
- Three White Soldiers = strong bullish continuation after a downtrend.
- Three Black Crows = strong bearish continuation after an uptrend.
- Inside Bar = potential breakout or continuation.
Example: In a downtrend, three consecutive long green candles with small wicks (Three White Soldiers) confirm buyers are in full control. This is a high-confidence buy signal.
5. Momentum Shifts
- Color change (e.g., red → green) = momentum shifting.
- Wide price swings with shrinking candles = momentum loss.
- Tweezer Tops/Bottoms = precise reversal points at highs/lows.
Real Example: After a series of red candles, a green candle forms with a long upper wick (Shooting Star) at a key resistance. This signals sellers are pushing back, and a reversal may follow.
What Candlesticks DON’T Tell You: 5 Critical Limitations
Despite their power, candlesticks have major blind spots. Beginners often over-rely on them, leading to costly mistakes. Here’s what they cannot tell you:
1. No Future Guarantee
A candlestick pattern is not a prediction. It’s a snapshot of past behavior. A Hammer can fail if there’s no volume or confirmation.
Example: A Hammer appears at support, but the next candle is a long red one with heavy volume. The reversal failed. Context matters more than the pattern alone.
2. Ignores Volume and Liquidity
Candlesticks don’t show how many shares were traded. A reversal on low volume is weak; on high volume, it’s strong.
Real Example: A Shooting Star forms at resistance, but volume is tiny. This is a false signal. If volume spikes, the reversal is credible.
3. No Macro Context
Candlesticks don’t account for economic news, interest rates, or sector trends. A bullish pattern can fail if the Fed announces a rate hike.
Example: A Three White Soldiers pattern forms, but the stock is in a declining sector. The trend may reverse due to external factors.
4. False Signals in Ranging Markets
In sideways markets, patterns like Hammer or Doji appear constantly but often fail. Candlesticks are less reliable without a clear trend.
Real Example: In a flat market, a Hammer appears daily. Most are false signals. Only trade reversals when there’s a clear trend.
5. Requires Confirmation
A single candle is rarely enough. You need confirmation from the next candle, volume, or moving averages.
Example: A Doji forms at resistance. The next candle is a long red one with heavy volume. This confirms the bearish reversal.
Top 16 Candlestick Patterns for Beginners: Breakdown & How to Trade
Here are the 16 most essential patterns every trader should know, grouped by type, with trading rules and real examples.
🔹 Single-Candle Patterns (4)
| Pattern | What It Signals | When to Trade | Real Example | Chart |
|---|---|---|---|---|
| Hammer | Bullish reversal after decline | At support, with volume | Stock drops 15%, forms Hammer at 50-day MA. Next candle is green with high volume → buy | 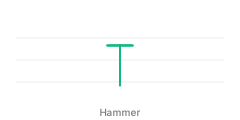 |
| Hanging Man | Bearish reversal after rise | At resistance, with volume | Stock rallies 20%, forms Hanging Man at resistance. Next candle is red with volume → sell | 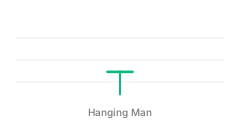 |
| Shooting Star | Bearish reversal after rise | At resistance, with volume | Stock hits all-time high, forms Shooting Star. Next candle is red, volume spikes → sell | 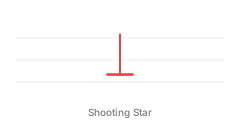 |
| Doji | Indecision | After long trend, at key level | After 25% rally, Doji forms at resistance. Next candle is red → reversal | 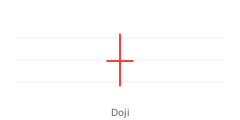 |
Key Rule: These patterns only work at support/resistance and need confirmation from the next candle.
🔹 Two-Candle Patterns (4)
| Pattern | What It Signals | When to Trade | Real Example | Chart |
|---|---|---|---|---|
| Bullish Engulfing | Strong bullish reversal | After decline, at support | Stock drops 10%, forms Bullish Engulfing. Next candle is green with volume → buy | 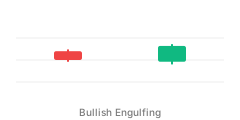 |
| Bearish Engulfing | Strong bearish reversal | After rise, at resistance | Stock rallies 15%, forms Bearish Engulfing. Next candle is red with volume → sell | 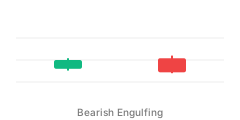 |
| Tweezer Top | Bearish reversal at high | At resistance | Stock hits new high, forms Tweezer Top. Next candle is red → sell | 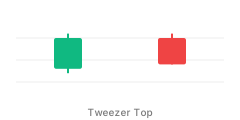 |
| Tweezer Bottom | Bullish reversal at low | At support | Stock hits new low, forms Tweezer Bottom. Next candle is green → buy | 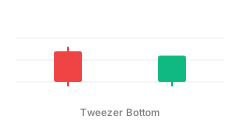 |
Key Rule: These patterns show clear reversal with strong momentum. Trade only with volume confirmation.
🔹 Three-Candle Patterns (5)
| Pattern | What It Signals | When to Trade | Real Example | Chart |
|---|---|---|---|---|
| Morning Star | Bullish reversal after decline | At support | Stock drops 20%, forms Morning Star (red → small → green). Next candle is green → buy | 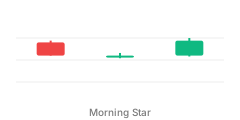 |
| Evening Star | Bearish reversal after rise | At resistance | Stock rallies 25%, forms Evening Star (green → small → red). Next candle is red → sell | 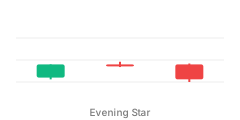 |
| Three White Soldiers | Strong bullish continuation | After decline | Stock drops 15%, forms 3 long green candles. Next candle is green → buy | 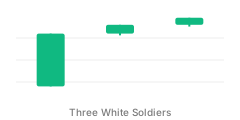 |
| Three Black Crows | Strong bearish continuation | After rise | Stock rallies 20%, forms 3 long red candles. Next candle is red → sell | 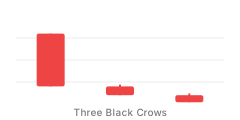 |
| Inside Bar | Breakout or continuation | After trend | After uptrend, Inside Bar forms. Next candle breaks high → buy; breaks low → sell | 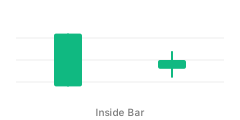 |
Key Rule: Three-candle patterns are stronger than single/two-candle because they show developed sentiment shift.
How to Trade Candlesticks: A Step-by-Step Framework

Don’t just memorize patterns. Use this proven framework to trade them with discipline:
Step 1: Identify the Trend
- Uptrend: Higher highs, higher lows → look for bullish patterns.
- Downtrend: Lower highs, lower lows → look for bearish patterns.
- Sideways: Equal highs/lows → avoid patterns or trade both directions.
Step 2: Find Key Levels
- Support/Resistance: Where price reverses often.
- Moving Averages: 50-day, 200-day MA as dynamic support/resistance.
- Fibonacci Levels: 38.2%, 50%, 61.8% as reversal zones.
Step 3: Wait for the Pattern
- Only trade patterns at key levels.
- Avoid patterns in ranging markets unless confirmed.
Step 4: Get Confirmation
- Next candle: Must move in the pattern’s direction.
- Volume: Must be higher than average.
- Moving Averages: Price must cross MA in the pattern’s direction.
Step 5: Set Your Trade
- Entry: After confirmation candle closes.
- Stop Loss: Below the pattern’s low (bullish) or above high (bearish).
- Take Profit: At next resistance (bullish) or support (bearish).
Hypothetical example:
- Stock drops 12%, forms Hammer at 50-day MA.
- Next candle is green with 2x average volume.
- Entry: $52.50 (after close).
- Stop: $50.00 (below Hammer low).
- Target: $58.00 (next resistance).
- If price reaches the target, the reward:risk on this trade would be roughly 2:1 — the outcome is never guaranteed.
Common Beginner Mistakes (And How to Avoid Them)
❌ Mistake 1: Trading Patterns Without Context
Fix: Only trade patterns at support/resistance with volume confirmation.
❌ Mistake 2: Ignoring Volume
Fix: Check volume before entering. Low volume = weak signal.
❌ Mistake 3: Overtrading in Ranging Markets
Fix: Avoid patterns in sideways markets unless confirmed.
❌ Mistake 4: No Stop Loss
Fix: Always set a stop below/above the pattern.
❌ Mistake 5: Expecting 100% Accuracy
Fix: Accept that even textbook patterns fail regularly. Focus on risk/reward and position sizing instead of hit rate.
Valuable Sources for Further Learning
To deepen your candlestick knowledge, explore these high-quality resources:
IG International’s 16 Candlestick Patterns Guide – Comprehensive breakdown with trading rules.
→ https://www.ig.com/en/trading-strategies/16-candlestick-patterns-every-trader-should-know-180615Groww’s 38 Candlestick Patterns for Pro Traders – Bullish/bearish patterns with real examples.
→ https://groww.in/blog/candlestick-patternsStrike Money’s 60 Essential Candlestick Patterns – Beginner-friendly guide with chart examples.
→ https://www.strike.money/technical-analysis/types-of-candlesticks-patternsStockCharts.com’s Introduction to Candlesticks – Technical analysis fundamentals.
→ https://chartschool.stockcharts.com/table-of-contents/chart-analysis/candlestick-charts/introduction-to-candlesticksCommodity.com’s Candlestick Basics – Clear explanation of open/high/low/close.
→ https://commodity.com/technical-analysis/candlestick-basics/YouTube: “How to Read Candlestick Shapes & Charts (ZERO experience)” – Visual tutorial for beginners.
→ https://www.youtube.com/watch?v=myUKta-wicQYouTube: “How To Read Candlestick Charts FAST (Beginner’s Guide)” – Quick tips for reading charts.
→ https://www.youtube.com/watch?v=AOz1YPOKvEsYouTube: “The Ultimate Candlestick Patterns Trading Course (For Beginners)” – Full course with examples.
→ https://www.youtube.com/watch?v=_I1omSmy44Q
Practice
- Drill pattern recognition with our Candle Count flashcard game.
- Size the trade correctly with the position-size & risk calculator before you enter.
Final Thoughts: Candlesticks Are a Tool, Not a Crystal Ball
Candlesticks are incredibly powerful for reading the market, but they’re not magic. They tell you what’s happening, not what will happen. The key to success is:
✅ Combine patterns with context (trend, levels, volume).
✅ Wait for confirmation (next candle, volume, MA).
✅ Manage risk (stop loss, position size).
✅ Accept uncertainty (no 100% accuracy).
When you master this, candlesticks become a useful part of your toolkit. Start small, practice on a demo account, and build your confidence. The market rewards discipline, not luck.
One last tip: If a pattern looks perfect but volume is low, skip it. Quality over quantity.
Now, go read the charts, spot the patterns, and trade with confidence. 🚀
Disclaimer: This guide is for educational purposes only. Trading involves risk. Always consult a financial advisor before making investment decisions.